
Introduction
Data visualization is essential to modern applications, enabling developers to represent complex datasets intuitively. Even though Elixir is broadly used for concurrent and distributed applications, the ecosystem lacks native charting tools that seamlessly integrate with its functional paradigm. Phoenix LiveView is a feature of the Elixir/Phoenix framework that enables real-time, interactive web applications with a minimal JavaScript code requirement. Phoenix LiveView can build rich, dynamic UIs using server-rendered HTML that updates automatically as data changes. Also, LiveView is a server-centric solution for real-time applications; developers often desire to execute more logic on the server side.
Data visualization is vital in converting raw and high-velocity data into clear, actionable insights in such systems, which motivates BigThinkCode to contribute to the Elixir Community with a robust and efficient charting library. Integrating plot generation directly within Elixir minimizes dependency on external tools, reducing architectural complexity. Given Elixir’s ability to code fast and scale efficiently, keeping most components native to the ecosystem maximizes performance and maintainability.
Highlights
Matplotex satisfies the need for native chart library in Elixir.
Matplotex enables server-side chart generation, which is highly beneficial for client-side devices with limited memory.
Matplotex‘s Scalable Vector Graphics (SVG) dependency produces high quality chart.
Matplotex offers line chart, pie chart, bar chart, scatter chart, spline chart and histogram.
Matplotex also has a plug-and-play interface that enables the addition of new charts and makes customization easy.
Solution Methodology
SVG is an excellent choice for server-side chart generation library due to its scalability, flexibility, and ease of integration. Unlike raster images, SVG charts are resolution-independent, ensuring crisp visuals at any size without losing quality. Since SVG is a text-based XML format, it can be dynamically generated, updated, and streamed directly from the server without heavy image processing, making SVG an ideal option for high-resolution data visualization applications. Additionally, SVG supports styling via CSS, interactive elements,and animations, allowing for rich, customizable charts without complex frontend libraries.
Phoenix is a robust web framework in Elixir known for its real-time capabilities and high performance. One of its key features is the HEEx (HTML-aware Embedded Elixir) template engine, which allows developers to write dynamic, component-based templates efficiently. Generating and injecting chart SVG codes into the HEEx template simplifies plot generation because the final HTML tags have chart SVG tags. So, SVG generation on the server side with the HEEx combination enables the hassle-free creation of dynamic, data-driven visualizations and maintains code structure effortlessly.
Matplotex: Elevating Data Visualization
BigThinkCode developed Matplotex, a lightweight and efficient library for Elixir projects that facilitates server-side SVG generation for data visualization to have high-performance visualization on client-side devices with limited memory resources and empowers the Elixir Community with native chart development. Matplotex is designed to integrate seamlessly with Phoenix LiveView and is a powerful tool for creating dynamic visualizations in web applications. Below are the key benefits and extended use cases of Matplotex:
Server-side SVG Generation: Matplotex enables the creation of larger, complex plots on the server, ensuring smooth performance on client-side devices with limited memory.
Efficient Concurrent Processing: Leveraging Elixir’s concurrency capabilities, Matplotex can handle multiple requests simultaneously, making it ideal for high-performance applications.
Cross-Project Compatibility: While optimized for Elixir, Matplotex can also be usedby non-Elixir projects through its API integration with the Phoenix framework, broadening its potential use cases.
Matplotex also leverages the power of Elixir's Nx library for efficient numerical computation, particularly for linear transformations, range calculations, and interval generation. Elixir's built-in data structures and types are not optimized for numerical programming, a gap that Nx effectively bridges. Nx provides optimized data structures (such as tensors) and functions for complex mathematical operations, empowering Matplotex. A typical Matplotex’s working principle is shown below.
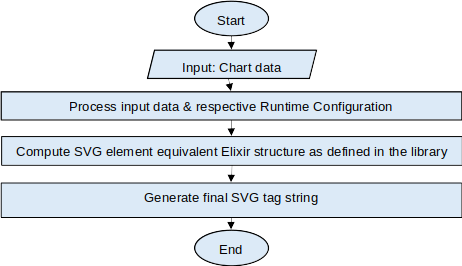
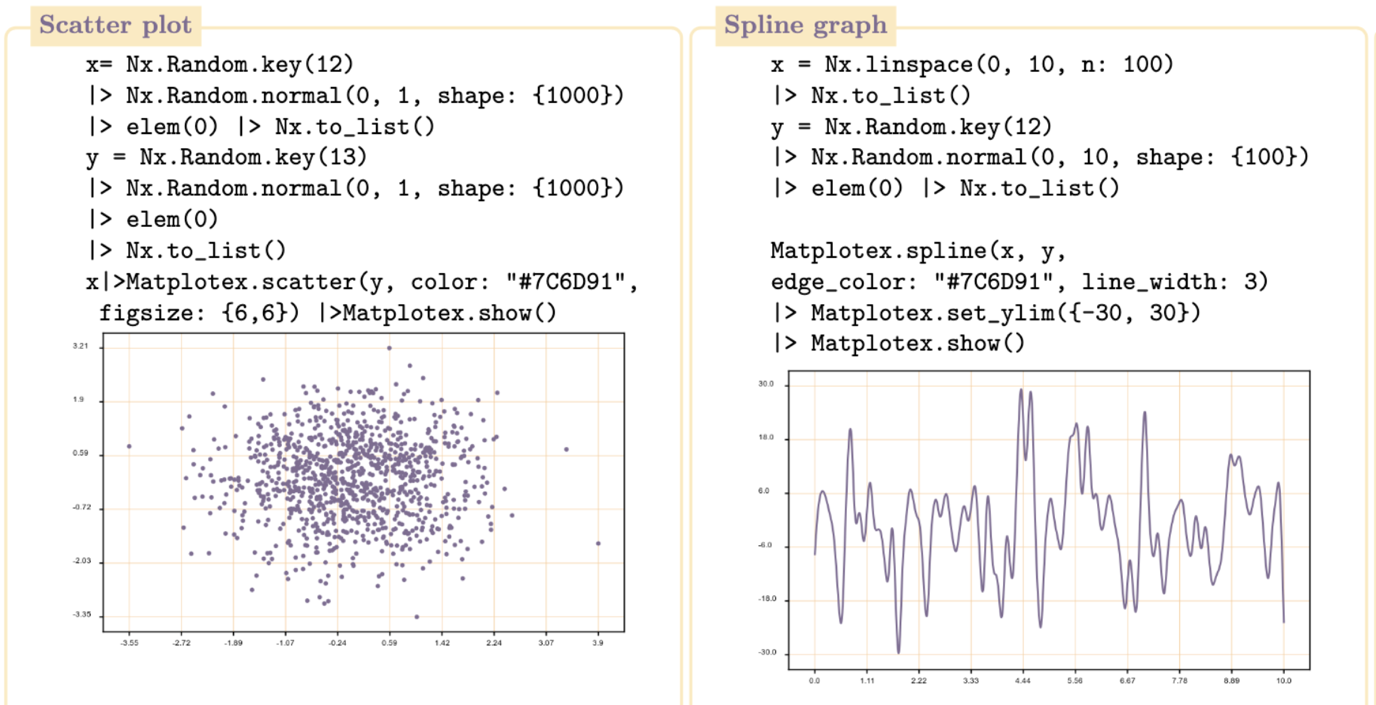
Illustrating Charts with Matplotex
Matplotex exposes an elixir module called Matplotex that wraps the APIs for various functions to generate the required plot structure. Also, Matplotex allows the library's users to customize various chart Runtime Configuration (RC) parameters, which are well-documented inHexdocs.
Illustrating Matplotex with Phoenix LiveView
Matplotex aims to provide more than just on-demand chart generation. Aligned with Phoenix LiveView's philosophy, it enables interactive, real-time chart updates directly within the LiveView context. The following example demonstrates this live updating capability.
Create a Phoenix project
mix phx.new dashboardAdd matplotex with deps
{:matplotex, :latest}Create a new file named dashboard_live.ex under lib/dashboard_web
defmodule InteractiveDashboardWeb.DashboardLive do
	use InteractiveDashboardWeb, :live_view
 	alias Matplotex

def mount(_params, _session, socket) do
  range = {0, 10}
  chart = generate_chart(range)
  Process.send_after(self(), :tick, 1000 )
  {:ok, assign(socket, chart: {:safe, chart}, range: range)}
end

def render(assigns) do
  ~H"""
  <div class="w-1/2 mt-8">
  <%=@chart %>
  </div>
  """
end

def handle_info(:tick, socket) do
  {begins_at, ends_at} = socket.assigns.range
  range = {begins_at+1, ends_at + 1}
  chart =   generate_chart(range)
  Process.send_after(self(), :tick, 100 )
  {:noreply, assign(socket, chart: {:safe, chart}, range: range)}
end

defp generate_chart({begins_at, ends_at}) do
  x_nx= Nx.linspace(begins_at, ends_at, n: 20)
  y1= x_nx |> Nx.pow(10) |> Nx.to_list()
  x_nx
  |> Nx.to_list()
  |> Matplotex.spline(y1, color: "#EE3377",label: "Tarus")
  |> Matplotex.set_xlim({begins_at, ends_at})
  |> Matplotex.show()
end
Update at router.ex with
scope "/", InteractiveDashboardWeb do
    pipe_through :browser
    live "/", DashboardLive
end
Running server (Check localhost:4000)
iex –S mix phx.serverContributing to the Elixir Community
At BigThinkCode, we believe in the power of open-source software to drive innovation. By releasing Matplotex, we aim to provide the Elixir community with a robust tool for data visualization, enabling developers to build scalable, high-performance applications. We welcome contributions, feedback, and feature requests from the community. Together, we can continue to refine and expand Matplotex to meet the evolving needs of developers worldwide.
The Road Ahead
Matplotex is more than just a library—it’s a testament to the spirit of pushing boundaries and striving for excellence, a philosophy that drives everything we do at BigThinkCode. With this release, our team aims to empower the Elixir community by offering a visualization library that is not only faster but also more reliable and scalable than anything currently available.
We’re excited to see how Matplotex will be adopted and extended by the open-source community, and we invite developers, researchers, and data enthusiasts to explore, contribute, and share feedback. Together, we can continue to refine this library and unlock even greater possibilities for the Elixir ecosystem. The future directions for Matplotex are:
GUI Integration: Adding graphical user interface (GUI) capabilities to Matplotex, providing an intuitive and user-friendly experience for generating plots.
Support for the Nerves Framework: Enabling real-time data visualization for embedded systems, such as sensor readings, using the Nerves framework.
Utilize Rustler-powered NIFs for high-performance execution on large datasets and efficiently converting charts into various file formats.
Get Started with Matplotex
Ready to experience the future of data visualization in Elixir? Visit the Matplotex GitHub Repository. The repository includes comprehensive documentation, examples, cheat sheets, and guides to help you get started quickly.
At BigThinkCode, we’re proud to push boundaries and deliver solutions that empower developers. We look forward to continuing to innovate and deliver solutions that drive the future of technology. Stay tuned for more updates as we take on new challenges and explore new opportunities to grow.
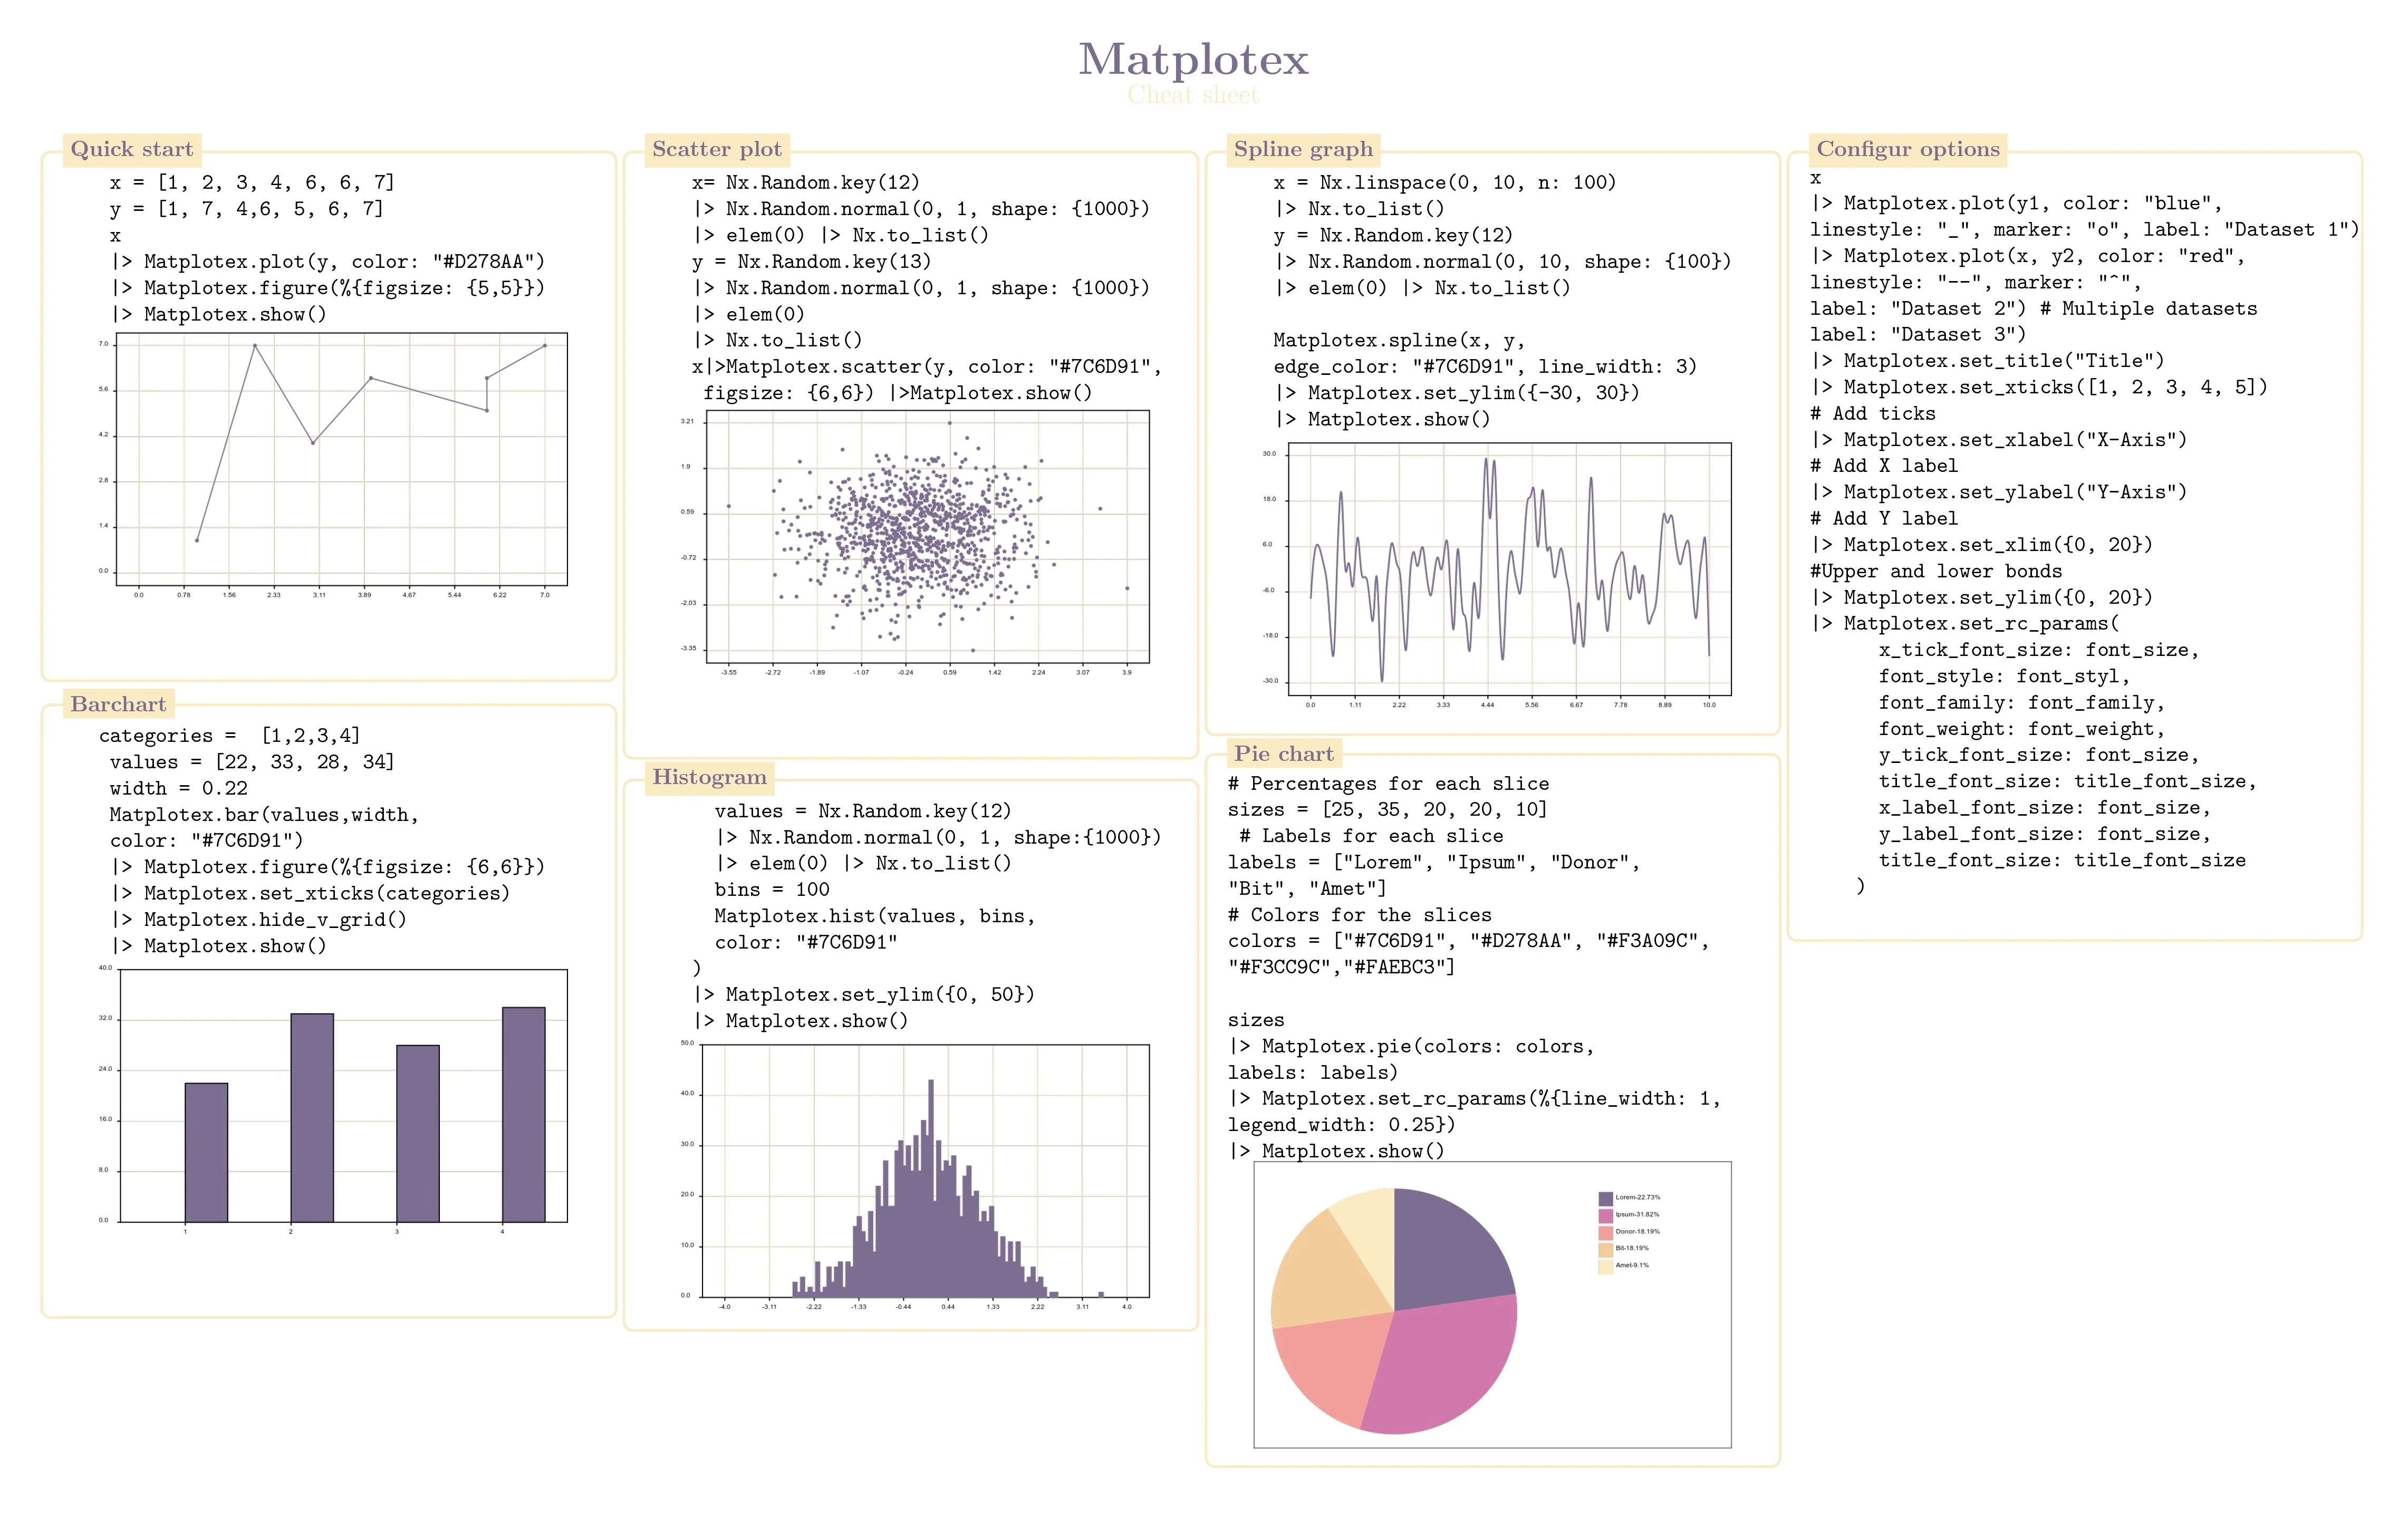
Cheatsheet for a quick start:
Conclusions
Integrating data visualization directly within Elixir applications enhances performance and maintain ability by reducing external dependencies and leveraging the language’s inherent strengths. Matplotex provides a seamless solution for generating server-side SVG charts, making it ideal for real-time, interactive applications built with Phoenix LiveView. By harnessing Elixir’s concurrency model and the flexibility of SVG, developers can create scalable, high-quality visualizations that integrate smoothly into their projects. As data-driven applications continue to evolve, tools such as Matplotex empower developers to present complex datasets effectively while maintaining the efficiency and simplicity of the Elixir ecosystem.
Talk to us for more insights
What more? Your business success story is right next here. We're just a ping away. Let's get connected.